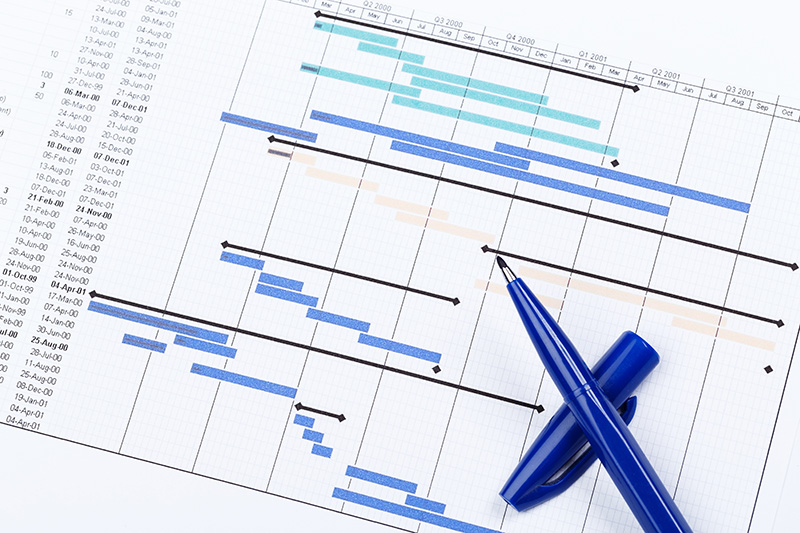
It’s hard to imagine managing a project without eventually building a task table. One of the most powerful project management tools is the Gantt chart. This type of chart enables team members to take a quick look at all tasks and track project progress.
If you’re looking for information about this tool, or how to manage a project effectively, you’ve come to the right place. In this article, we’ll find out everything you need to know about the Gantt chart.
What is a Gantt chart?
The Gantt chart is an essential tool for project management, enabling you to plan tasks, allocate resources and monitor progress. A chart that presents all the project’s distinct tasks on a timeline, using horizontal bars to represent the duration of each task. This makes it easy to visualize the sequence of tasks and track their progress.

It is a practical and effective way of organizing and coordinating projects, not least because of its visual nature and the inclusion of the following elements:
- The deadline and duration of each task must be clearly defined;
- Task list ;
- Task managers are software applications that help individuals and teams organize and manage their projects more efficiently;
- Milestones …
The usefulness and advantages of the Gantt chart
- The various tasks to be considered;
- Start and end dates for each task;
- The expected duration of each task;
- The possible overlap of tasks, and the duration of this overlap;
- The start and end dates of the project as a whole;
- A clear, visual tool that helps you keep track of your task planning, structures your approach and helps organize your project.
What are the limits of the Gantt chart?
As with any tool, using the Gantt chart has its drawbacks, which are as follows:

So now you know everything you need to about the subject, all you have to do is take action.
Written by Ines Berkat
Read also
How to make the right decisions?
Eisenhower Matrix: Save time and increase productivity
Does the ratio 20/80 appeal to you? It is PARETO who is at its origin